Home

FREE On-line Residential HVAC Design Training

2 Comments

NOTE: These classes are done. A very similar class was recorded and posted on our YouTube Channel, here: https://www.youtube.com/watch?v=1IrMBbjEgjE&list=PL_287eMrjGiH1w1YTsWbAj83lxrhcUioC

Hi Everyone,

Just wanted to pass this along. I’ll be teaching a couple classes in the next couple of weeks.

The great folks at Southern California Edison’s (SCE’s) Energy Education Center in Tulare, CA are hosting free residential HVAC Design Training

Featuring the Award-Winning Kwik Model with EnergyGauge Loads!

Not only is Kwik Model an awesome 3D design tool, but its 3D virtual environment makes it the best training tool available.

The first class is an introductory class, followed the next week by two classes (Parts 1 and 2), one on Tuesday and one on Wednesday.

The introductory class is optional, but recommended.

Part 2 is a continuation of Part 1 – please register for both

Anyone can attend these classes and participate from anywhere.

Check out these FREE LIVE (on line) classes – class descriptions below:

Intro to Residential HVAC Design in 3D

Tuesday, March 1, 2022

2:00 p.m. – 5:00 p.m. (Pacific)

Register Here

3D Residential HVAC Design (No CAD Required) – Part 1

Tuesday, March 8, 2022

2:00 p.m. – 5:00 p.m. (Pacific)

Register Here

3D Residential HVAC Design (No CAD Required) – Part 2

Wednesday, March 9, 2022

2:00 p.m. – 5:00 p.m. (Pacific)

Register Here

Class descriptions:

Introduction to Residential HVAC Design in 3D

This class will be an introduction to ACCA Manuals J, S and D (load calculations, equipment sizing and duct design) using a new 3D HVAC design software. Rather than drawing the house in a CAD software, this software “builds” the house out of scalable 3D boxes. The benefit of 3D design is that it helps make sure that the system being designed will actually fit in the house and gives a better indication of duct length, surface area, bends and fittings. Attendees should have a good working knowledge of HVAC terminology and concepts.

Course Objectives: 

• Understand the basics of building geometry.

• Understand the basics of heating and cooling load calculations.

• Understand the basics of heating and cooling equipment selection.

• Understand the basics of duct layout and sizing.

• Understand the importance of good airflow on cooling equipment capacity and efficiency.

• Understand the importance of proper register/grille location, sizing and type.

Target Audience:

• HVAC Contractors

• HVAC Designers / Architects

• Energy Consultants

• HERS Raters

Learning Level:

Basic Class: Content is introductory in nature and requires no prerequisite knowledge or experience to grasp the concepts or participate in exercises. Basic educational activities and materials are meant to establish a foundation of knowledge and competence that will be expanded upon in practice or in higher level seminars and workshops.

Prerequisites: Attendees should have a good working knowledge of HVAC terminology and concepts.

3D Residential HVAC Design – Parts 1 and 2

Part 1 will cover load calculations and equipment sizing according to ACCA Manuals J and S (duct design according to Manual D will be covered in Part 2). The training will be based on a new 3D HVAC design software. Rather than drawing the house in a CAD software, this software “builds” the house out of scalable 3D boxes. The benefit of 3D design is that it helps make sure that the system being designed will actually fit in the house and gives a better indication of duct length, surface area, bends and fittings. Attendees should have some basic experience using an HVAC design software and/or knowledge of ACCA Manuals J/S/D, and a good working knowledge of HVAC terminology and concepts. It is highly recommended that you take Part 1 before taking Part 2. Part 2 will be held at the same time the following evening.

Course Objectives: 

• Understand the basics of how building geometry affects load calcs.

• Understand the basics of heating and cooling load calculations.

• Understand the basics of heating and cooling equipment selection.

• Become comfortable with the basic commands of Kwik Model with Energy Gauge Loads software.

Target Audience:

• HVAC Contractors

• HVAC Designers / Architects

• Energy Consultants

• HERS Raters

Learning Level:

Intermediate Class: Content is appropriate for individuals who possess a fundamental understanding of the topic and have familiarity with basic terminology and methodology of the subject matter. Attendees should have the capacity to participate in instructor-led exercises requiring synthesis and application of concepts.

Prerequisite: Basic experience in HVAC design software and/or knowledge of ACCA Manuals J/S/D and an understanding of HVAC terminology and concepts.

Don’t miss out.

Mark your calendars now.

We hope you can make it!

Advertisement

Relieving the Pressure: Bypass Grilles, Jumper Ducts, and Dedicated Returns

2 Comments

(Image borrowed from the internet.)

Disclaimer:  The vast majority of my HVAC design experience is for new construction, production homes, in hot-dry climates (CA and NV).  I’ve estimated that I designed at least a couple thousand plans, each plan built many times in multiple orientations.  I never had any significant comfort complaints result from my designs.  We always used Manual J/S/D.  We designed to high airflow (>400 cfm/ton) low-ish external static pressure (<0.6 IWC) and we were careful not to oversize the air conditioners.  We also field tested most of these designs.  This article is based on that experience.  I don’t claim to be an expert on the topic of room pressurization, nor have I done a whole lot of research on the topic.  I’m just sharing my experience and opinions so that, good or bad, others may add it to their knowledge base and make informed decisions. Please feel free to comment and give your opinion and experience.

To start, let’s define the problem.  First, imagine a house with no interior doors and one central return grill in a hallway.  The return path from a supply register in a bedroom is out of the room through the door and down the hallway.  The rooms and hallways are essentially return ducts – nice, big, open ducts with little to no resistance to the air.  I think (I hope) we can all agree that in this situation, there would be no need for ducted return grilles in every bedroom.

Now add the interior doors.  These doors are essentially dampers in our nice big return ducts.  When these door/dampers are closed it creates significant blockage in our nice big return “ducts”.  I think (I hope) we can all agree that it’s the doors that are causing the problem.  Theoretically, they stop the air from leaving the room, which prevents supply air from entering the room, potentially causing under-conditioning of the room.

  1. My first question is:  How often and when are these doors closed?
  • My second question is: When a door is closed how big is the impact on the supply air flow to that room?
  • My third question is: How should we address the problem caused by closed doors?

My experience designing and testing HVAC systems in homes leads me, personally, to the following answers:

#1. Not often enough during peak load conditions to be a problem.

#2. Not big enough during peak load conditions to be a problem.

#3. What problem?

Keep in mind that the homes I design are very energy efficient (compared to other homes built at that time), the systems are properly sized, and the ducts are well designed for good airflow. This means that during peak loads (very hot days) the system is running almost continuously, the air is mixing well, and the supply air is not coming out of the registers super cold or super hot.  I never really made a big effort to check, but I recall that most of the bedroom doors in these homes had decent undercuts, say, 1” above the flooring.  I should also mention that I always insisted on a dedicated return in the master suite. If all these boxes are checked, I contend that pressure relief in secondary bedrooms is not necessary for comfort reasons.

I always try to make a point to say this in every class I teach: “A well-designed system will forgive a lot of sins.”  What I mean by that is a house with a properly sized system (not oversized) and good airflow will work fine despite:

  • Less than optimal register locations
  • Less than optimal room by room air balancing
  • Less than optimal thermostat location
  • Less than optimal owner behavior, and
  • Some room pressurization

The reason I emphasize comfort a couple paragraphs earlier is because there may also be energy efficiency reasons for pressure relief.  The Florida Solar Energy Center (FSEC) did a study on how room pressurization increases infiltration (exfiltration) and therefore energy consumption.  I have not read this study yet and do not know how tight these homes were, how often the doors were closed, how effective the door blocked airflow, how well the ducts were sized, etc.  Assuming that there is increased energy consumption, a cost effectiveness evaluation is warranted to justify pressure relief strategies.  As we will see, some strategies are more expensive than others.

I have tested houses designed by other people where there were severe comfort issues and room pressurization seemed to be part of the problem.  They installed pressure relief strategies and the problems mostly went away, but unfortunately, they also did other fixes, such as increasing return air capacity, sealing ducts, etc., so it is impossible to know how much impact the pressure relief strategies had or how much of a problem they were to begin with.

I guess you could say that my most used pressure relief strategy is to have big supply air ducts.  By “big” I mean a lot bigger than those installed by people who do not used Manual D.  I might put an 8” duct in a room where someone else might think a 6” duct is fine.  In very simplistic terms, when your duct system is big, the air is moving slower, the pressure drop into the room is lower and the overall system can compensate more easily to parts of the system being blocked off.  For example, if you were to close off a register in a room in a house with “big” ducts, that back pressure is easily absorbed by the rest of the system.  If the house had small ducts, the new back pressure is felt all the way back at the fan.  In other words, the pressure behind the closed off damper at the register is greater in a system with small ducts than in a system with large ducts.  I have not personally tested this, but if that damper is now the bedroom door, rather than the register, the pressure in the room should also be less when the ducts are big, all else being equal.  On the other side, one could argue that a system with big ducts is more likely to reduce airflow to a room when a door is closed because there is “room” for it to go elsewhere.  True, but the room is less pressurized, so the energy impact is reduced.

So, other than big ducts, what are the more common pressure relief strategies?  I categorize them as follows:

  1. Louvered bypass grilles
  2. Jumper ducts
  3. Dedicated ducted returns

I will evaluate them based on the following qualities (or lack thereof):

  • Balance/Comfort –Does it reduce the impact of opening and closing doors and thereby increase comfort?
  • Noise/Privacy – We have doors on rooms for a reason.  Does the pressure relief strategy allow outside noise to disturb the room occupants? Does it allow private conversations inside the room to be eavesdropped on from outside the room?  Note that this is very hard to quantify and varies widely from family to family.  I personally think this issue gets more attention that it deserves, but I never lived in a large family.
  • Aesthetics – Is it ugly?  Is it visually conspicuous?
  • Cost – Is it expensive to install relative to the other options?
  • Energy – Does it increase energy consumption?

Here are the three strategies, in detail:

  1. Louvered Bypass Grilles

These basically just provide additional pressure relief much like the undercut of the door.  They are usually the simplest and easiest to install.  They can be as simple as a louvered door, or back-to-back grilles in an interior wall (one side to room, one side to hallway), or ducted high/low grilles on either side of an interior wall.

There are some very nice-looking louvered doors available.  Personally, if I could design my own house from scratch, it would have fully louvered doors everywhere but on the bathrooms.  I just like the look and the good air circulation.  Doors can be fully louvered or partially louvered.  Even off-the-shelf panel doors from the big box stores have room at the bottom to install a 6” tall louvered panel.  These louvered door panels are common in commercial applications

Image from www.trudoor.com

Back-to-back louvers are similar but, in a wall, rather than a door.  See drawing, right side.

High/low louvers are similar but to mitigate sound transmission one side is up high and one side is down low.  See drawing, left side.  I have never seen these installed.  I heard of someone who wanted to, but a sharp building inspector pointed out that the section of the code that prevents us from using unducted building cavities as return ducts could apply here and that the stud bay should probably be lined with an approved ducting material.   In a hot-dry climate, I would not have any issues with passing room air through a well-sealed, unlined, stud bay, but in a humid climate it could be a mold issue. 

Sizing these louvers is tricky.  It depends on a lot of things.  I’m sure there are fancy equations for calculating the pressure drop of the various options, but I prefer empirical data and experimentation.  A target pressure differential across the door that I have seen referenced many times is 3 Pa.  I’m not sure how this number was arrived at, but it seems reasonable.  If you don’t like it, pick a target – the lower, the better.  It would be quite easy to build a test chamber using a calibrated fan, such as a duct tester and test different size louvered configurations at different airflows.  If the grilles you are using have good performance data, such as for supply registers, you could use that to predict pressure drop too. Be sure to account for the door undercut, or just use that as “safety margin”.

Here is my “scoring” of louvered bypass grilles as a pressure relief strategy.

  • Balance/Comfort – Very good.  Assuming proper sizing these should perform fine.
  • Noise/Privacy – Probably not good, especially fully louvered doors.  With louvered grilles I can imagine a younger brother being caught with his ear to a louvered register spying on his big sister’s phone conversations.  (It’s amazing what you can hear with your ear to a floor register when the system is not running, but no one complains about that.)
  • Aesthetics – I love the look of louvered doors, but then, I also like jalousie windows because they remind me of living in Hawaii as a child and the windows on our old VW camper.  On the room side, louvered grilles can be hidden behind furniture, but they might not look great on the hallway side.
  • Cost – Louvered doors can be pricey.  Back-to-back louvers installed in walls (or doors) are probably the cheapest of all options mentioned here.  High/low louvered would be expensive if you had to duct the wall cavity, otherwise pretty cheap.
  • Energy – Great.  No negative impact on energy use.
  • Jumper Ducts

These are very common in some parts of the country and in some energy efficiency programs.  They are probably the most common pressure relief strategy.  They are similar in function as louvered bypass grilles.  They provide an alternative return path past the door in addition to the door undercut.  The main difference is that they are in the ceiling rather than a wall and they are ducted.  There is one register in the room and then there can be a shared register or individual registers in the hall or common area.  When the system is running and the door is closed the air goes up into the register in the ceiling of the room, through the duct and out the register in the hall and back to the return.  See diagram.

Again, sizing of the ducts and registers can be tricky, but I have seen some sizing charts that people have put together specifically for this application.

Here’s my evaluation of jumper ducts:

  • Balance/Comfort – I think these are very good too.  Assuming proper sizing, they should work very well.
    • Noise/Privacy – Definitely better than the louvered bypass grilles.  Being up in the ceiling and ducted limits most sound transfer.
    • Aesthetics – Probably better to have the grilles in the ceiling than in the walls.  The ability to share the hallway grille helps too.
    • Cost – Substantially more than louvered bypass registers.  You have a ceiling boot at both ends, the duct material and the labor to install it all.
    • Energy – If the bypass duct is in conditioned space, there should be no energy impact, but this is probably rare.  In the more common scenario of jumper ducts in a vented attic, I think the energy impacts are their biggest disadvantage. They increase surface area for conduction, and unless perfectly sealed, they increase building infiltration.
  • Dedicated Ducted Return

This is basically putting a return duct in every bedroom.  Each bedroom will have a supply and a matching return, presumably sized to handle the same amount of air.  As I mentioned earlier, I insisted that all my designs had a dedicated return in the master bedroom.  This was because in new homes the master “suite” was quite large.  They usually included the master bedroom, master bath, toilet room walk in closets and sometimes a separate retreat area. The amount of supply air going to that side of the main door was quite large and the pressure across the closed door could be substantial.  I had good success with this strategy, but occasionally I found that if the owners kept the master bedroom door closed a lot, like all day, that room was not well monitored by the thermostat out in the hall and sometimes the temperature drifted away from the thermostat setpoint.  In larger homes that had more than one system, we often put the thermostat in the master bedroom for that reason.

  • Balance/Comfort – Poor.  Now, I’m admitting a bias here.  I only designed one project where the builder insisted on returns in every bedroom, and it was a nightmare.  This was a subdivision of large (3500-5000 sf), one-story production homes.  There were three or four models.  The builder was new to Las Vegas and had previously built homes on the east coast.  Despite my objections, he insisted that a return in every bedroom is what made a house a “quality” house.  The problem was that the City of Las Vegas required balance testing on the sales models of all subdivision projects.  This meant you had to measure and report all supply and return airflows at every register and they had to be within 10% of design.  This was a very hard criteria to meet for regular systems.  I had no idea how hard it was going to be for multiple-return systems.  At that time they did not specify if the test was to be performed with bedroom doors open or closed, so we tested both ways in hopes that one would pass more easily. 

I won’t go into the specifics, but even though we very carefully sized the ducts according to strict Manual J/S/D protocols, it was a nightmare to balance these systems.  Here’s just a small example:  We would measure the supply and return airflows to a bedroom with the door open.  They would be different despite being the same size ducts, registers, duct length, everything.  It is impossible to intentionally make the total equivalent length (TEL) of a supply and return duct be the same.  We could adjust the registers and maybe some balancing dampers until they were close, but then we would close the door and measure airflows.  They would both change by different amounts!  Without making any further changes, we would open the door and measure again.  Would they go back to the original measurements? NO! They would be totally different than before.  No other changes were made.  It was infuriating.  It has to do with the fact that there are two pressures acting on the room instead of just one and that there is more than just static pressure forcing air down certain pathways in the ducts.  There is also velocity pressure.  Think of it as the momentum of the air.  When you change velocity pressure it changes the way the air “wants” to go.  When you change the static pressure back, the air might say, “Nah, I kind of liked going this way.” 

I suspect that few contractors who install systems with returns in every bedroom ever had to balance them like we did.  If they had to, I’m sure they would find an easier way to achieve pressure relief.  Once we finally got them dialed in I told the builder that because he insisted on dedicated returns against my advice, we would not be responsible for any additional “fine tuning” requested by homeowners.  There weren’t many requests, fortunately, but the systems weren’t as trouble free as one would have expected for all the extra expense and work that went into them.

Despite that bad memory, I also think there are other problems caused by this design strategy.  I alluded to it earlier where I mentioned putting the thermostat inside the master suite. Everything, of course, depends on the system and layout, but for the “typical” system I have found that comfort is best achieved when the thermostat is measuring a good representative sample of all the air in the house.  This depends greatly on the thermostat location and that is a whole other topic to discuss later.

When a system is running, you want the air passing by the thermostat to be a good representation of air from all the rooms.  When you give a room its own return you effectively take that room out of them mix.  You take away its “vote”, so to speak.  If the thermostat is in the hallway where the bedrooms are and all bedrooms have their own returns, that hallway can actually become stagnant with no moving air.  Thermostat location is very important in these types of systems.

  • Noise/Privacy – Good. No sound transmission
  • Aesthetics – Good. Fewer registers than the other options.
  • Cost – Poor.  Much more expensive than the other options.
  • Energy – Poor.  Unless ducts are located within conditioned space, this strategy will greatly increase duct leakage and convection.  Also, note that longer return ducts add significant equivalent lengths to the entire system, which changes the friction rate for every run.  This potentially could require larger ducts on both the supply and return sides to compensate for this additional resistance.

Conclusion

I can’t emphasize enough that a good design (not oversized equipment, good airflow, low design ESP) greatly reduces the need for these types of “enhancements” to a ducted HVAC system. 

Secondly, I don’t want to discount the induced infiltration and energy problem.  It is worth evaluating the energy savings vs the cost of these strategies on a case-by-case basis.  More research is needed here.  I suspect that in tighter homes with better designed duct systems, the impact is greatly reduced.

Lastly, until I have seen some detailed temperature vs time data logger analysis of systems with and without different pressure relief strategies, I will be skeptical of their overall benefit to comfort.  Here’s why: If closing a door supposedly creates pressure, which reduces supply air to a room, then the result would be an underconditioned room (hot in the summer, cold in the winter).  What I have actually heard from as many homeowners as not, is that the rooms where the doors are often closed get over conditioned.  In fact, in my own house, in heating mode, if we close our master bedroom door, it gets too hot at night.  If we leave the door open, it’s just fine.  We do not have a return in that room, btw.  This makes no sense to me.  Clearly there are other factors at play besides just a pressure difference across the door and it will take more to remedy than just pressure relief.

Ceiling Registers vs. Floor Registers

2 Comments

Which is better for distributing heated air to a house, ceiling registers or floor registers?

This seems like an easy question. Hot air rises so blowing the air up would improve the flow. This makes sense on the surface, but let’s look deeper.

First of all, let me make it clear that if the system is properly designed, both will work just fine.  But, all things being equal, is one better than the other, even if only slightly?

Recall that the purpose of blowing heated air into a room is to maintain a constant temperature over time and an even, consistent temperature everywhere in the room.  That temperature is whatever the thermostat is set at. Let’s say that’s 70 degrees.  When the heating system stops, the room begins to cool off.  Hopefully the thermostat will sense that and turn the heating system back on. This cycling on and off can cause problems.

The air that we are blowing into the room is substantially hotter than the air in the room.  In other words, we are adding concentrated btus into a volume of air to replace the btus that the air has lost.  It’s sort of like adding red food coloring to white frosting, but the red keeps fading away and we have to keep adding more concentrated red coloring.  We want the frosting to have a very even color, no dark streaks (hot spots) and no light streaks (cold spots).  To do this we have to mix as much as we can.  Mixing is the key to even temperature distribution in a room.

The next thing to look at is the register itself.  What is the purpose of the register?  Take a typical stamped-face 2 way ceiling register and a similar floor register.  Why are there 2 directions?  To send the air to different parts of the room, of course.  Why do we want to do that? So we don’t have hot spots and cold spots.  In other words, the register is designed to distribute the air around the room, which is another way of saying to mix the air

Also notice that the registers are angled to direct the air away from whatever surface the register is mounted in.  Ceiling registers throw the air down and floor registers throw the air up.  Also notice that they have a horizontal direction, parallel to the ceiling or floor.  This horizontal distance the air travels before slowing down to a certain velocity is what is referred to as the “throw distance”, but there is also a significant vertical component.  Register manufacturers provide specifications for their registers, including throw distance, static pressure drop, and noise criteria, at different face velocities and flow.  Again, supply registers are intended to push the air to all parts of the room to ensure even temperature distribution.  So, hopefully you will agree, that the key factor for selecting a good register location (and type) is to promote mixing

Another issue that comes into play is that warmer air is less dense than colder air.  Notice the “-er” at the end of those two important words, warmer and colder.  It’s not correct to say that “hot” air rises, but of course when people say that they usually mean “hotter”.  Hotter air rises in the presence of colder air.  It’s relative.  Most people would consider 120 degree air “hot”.  I could make 120 degree air come out of a wall register and sink to the ground like fog at a Transylvania cemetery.  How?  Make the room 160 degrees first.  Not very practical, but you get the point.

How do we reduce stratification? By reducing the temperature difference (delta T) between the room air and the supply air.  How do we do that?  One way is to reduce the supply air temperature by increasing cfm.  You can do this by increasing ducts sizes and reducing restrictions.  You can also do it by increasing the speed that the air handler runs on in heating mode.  Other than that, the easiest and best way to reduce the temperature difference between two masses of air is the mix them.  The sooner the air mixes together, the less chance there will be of stratification.

So, how do we mix the air?  A giant blender in each room would be great.  That’s basically what a ceiling fan is.  Ceiling fans are awesome! Make sure it is blowing up in the winter and down in the summer.  They beat the air like a scrambled egg, virtually eliminating stratification. Unfortunately, they use electricity and home owners tend to leave them on too much. Other than ceiling fans, we can help the air mix with register placement and selection.  Mixing is helped by turbulence.  Turbulence is created by making the air do things that it doesn’t really want to do.  Blowing the air the opposite direction that it wants to go can create turbulence, like a bunch of people going out the entrance of a building while other people are trying to come in, like cars going the wrong way on a freeway.  If hotter air wants to rise, blowing the air up will only get it up to the ceiling faster, where it will stay.  Blowing hotter air down will make it go down through the colder air and then fight its way back up, by that time it has mixed and cooled off: lower delta T = less stratification.

Note that there are two types of air movement in a room that is caused by the incoming supply air.  The primary airflow is caused by the force and velocity of the air coming out of the register.  The secondary airflow takes over when the air has lost its momentum and other forces take over.  These forces are usually stratification (buoyancy pressure) or the fact that the room is being pressurized, assuming there is no return grille in the room, the air has to leave the room and is being pushed out by the air coming in behind it.

Note that higher face velocity of the air coming out of a register can improve mixing but it can also have other negative affects, such as higher static pressure drop (resistance) and noise.  It’s very important to realize that face velocity is completely different than the velocity of the air in the duct.  You can have extremely slow air in a large duct and very high face velocity if the air is coming out of a small register.  Velocity is cfm/area.  The area of the duct is usually very different than the net free area of the register.

The image below shows what happens when hotter air is blown up into a colder room.  The primary airflow sends it up toward the ceiling and there is little secondary airflow to make it go anywhere else.  This exacerbates stratification.

Image from HVAC 1.0 – Introduction to Residential HVAC Systems

This next image shows what happens when hotter air is down into a colder room.  The primary airflow sends it down toward the floor and the secondary airflow causes it to want to rise back up toward the ceiling.  This promotes mixing and reduces stratification.

Image from HVAC 1.0 – Introduction to Residential HVAC Systems

Based on this and with all else being equal (airflow, delta T, face velocity, etc.) registers in the ceiling are more likely to promote mixing of heated air blown into a room and the ceiling is therefore a better location for supply registers in heating mode than floor registers.

Friction Rate Explained (Maybe)

6 Comments

Table 1 – Duct Size vs. Airflow at a Friction Rate of 0.1

Friction rate is is that number that you use on a duct calculator (aka, duct slide rule, ductulator, etc.) to figure out what size duct you need for a certain airflow.  It is one of the most complicated concepts to understand in the ACCA Manual D duct design methodology. It is even harder to explain to others (as you can tell by the length of this blog article). I have tried many times, with mixed success. I will try again now. At the very least you can laugh at my stupid analogies.

One of the biggest mistakes people make with friction rate is confusing it with static pressure. I’ve had people very confidently tell me that they “always use half inch on my ductulator because that’s what they design their total airflow to”. This makes me cringe. That means they are using 0.5 instead of something like 0.1, which means that they are expecting a bit more than twice as much air from a given size duct than what it will really deliver. Please, please, don’t do this. I’ve actually had people get quite angry with me for correcting them on this. Sorry. I’m just the messenger.

TESP is the total static pressure that your fan feels. Some of the pressure is on the return side and the fan has to pull against that pressure. Some of the pressure is on the supply side and the fan has to push against that pressure. The fan has no idea what is causing this pressure. It is just a dumb box with no eyes, ears or antennae. All it feels is negative pressure on one side and positive pressure on the other side. Those pressures could be caused by a box with a bunch of holes drilled in it, or a bouncy house, or a 3-mile-long sheet metal duct, or a tuba, or something else. It doesn’t matter. What matters is that you add those two pressures together, supply and return, (ignore the negative sign on the return pressure) and that’s the TESP. That’s how hard the fan is working. The harder it has to work, the less air will come out. Simple. Always, keep it simple.

The TESP is what the manufacturer’s airflow tables use to tell you how much airflow (cfm) the fan will deliver. The airflow table (chart, graph, whatever) tells you that at a certain TESP and a certain speed tap (high, med, low, etc. – let’s keep it simple and just focus on high speed), this fan will deliver a certain airflow, cfm. Friction rate is something completely different, related, but different. One is a total and one is a rate of something happening, like miles and miles per hour.

Another big mistake that “designers” make is that people assume that their systems will operate at a certain static pressure just by hooking up ducts and turning it on. They’ve heard a million times things like “ this fan delivers 400 cfm per ton at 0.5 inches of water column (iwc)”, so they just assume that’s what’s happening. They don’t realize that you have to design as system to those specifications for it to actually happen. In other words, if you want 400 cfm/ton, you have to design the ducts system so that the furnace only “feels” 0.5 iwc. Whether or not the furnace feels 0.5 iwc depends ultimately and completely on what kind of system it is attached to. It’s even worse for variable speed fans. People think they are magic and that no matter what kind of system they hook it up to, it will magically deliver the target airflow. Do not make this mistake.

So, how do you do design a duct system that will make the fan feel a certain static pressure? That’s where friction rate comes in. Friction rate allows you to pick a desired airflow, determine the static pressure needed to deliver that airflow (from the airflow tables) and then design the ducts around that static pressure to ensure that you get your desired airflow. These are the basic steps:

  1. Pick a desired cfm (e.g., 400 cfm/ton)
  2. Look at the airflow table and pick a TESP that will give you that cfm (e.g., 0.5 iwc).
  3. Calculate a friction rate based on that static pressure (e.g., 0.1 iwc/100’)
  4. Use that friction rate to size the ducts.
  5. Install the system, turn it on and you get the TESP you wanted (or less) and the cfm you wanted (or more).

Simple. Well, pretty simple.

Then why don’t more people do these steps? Because dummies like me keep continually throwing out numbers like 400 cfm/ton, 0.5 iwc, and 0.1 iwc/100’ in all their examples and everyone says, “If that’s what they always are, why do I need to bother calculating them?” Well, that’s a valid question. Those numbers are “typical” numbers, averages. If you were to design thousands of similar systems, they would all average out to about these numbers. I’ve done, it. It’s true.

Unfortunately, it’s not that simple. There’s enough variation between unique houses and individual equipment brands that you can’t just make these assumptions. That’s a recipe for trouble. Just like assuming that a 3 ton AC will give you exactly 36,000 Btuh. It won’t. Trust me. (Hopefully, those last few sentences don’t come as a surprise to you. If they do, you better read ACCA Manual S, quick.)

An analogy is fuel economy in cars. Some cars are less than 10 mpg and some are more than 30. Let’s say the average mpg for all cars is around 20. If you have to buy the exact amount of gas it takes to go a certain distance and assume you will get 20 mpg without knowing what kind of car you will be driving, chances are about 50/50 that you will run out of gas.

When furnace manufacturers design their fans-in-a-box, they typically shoot for a certain target airflow because that’s what everyone is used to, usually 400 cfm/ton. Some are better (higher airflow), some are worse. Not only does it vary between manufacturers, but it varies within difference sizes of the same furnace line. A two-ton furnace (the furnace that they intend to be paired with a two ton condenser) might give you 860 cfm at 0.5 iwc (430 cfm/ton). But the five-ton furnace (the furnace that they intend to be paired with a 5 ton condenser) might only give you 1920 cfm at 0.5 iwc. (384 cfm/ton).

The vast majority of my designs were for large production home builders who sent our designs out to get bids. Some big production home builders had national accounts with certain HVAC equipment manufacturers, so we could use those specs. Some did not, which meant that our design had to be generic – not specific to one brand. To do a generic design, we typically had specs from 5 or 6 of the top manufacturers and averaged the all the specs and then used design criteria that was worse than the average. (We didn’t want to eliminate any manufacturers by using criteria they couldn’t meet.) When we did his averaging, guess what the static pressure, and airflow typically turned out to be – Right around 400 cfm/ton at 0.5 iwc!

Whatever airflow and TESP you choose, the key is that you design your duct system to that TESP, as opposed to assuming that it will just magically happen. Remember the 5 steps I mentioned above? We are on now onstep 3, calculate a friction rate. (Finally, he’s talking about friction rate!)

So, what is friction rate (FR) and how is it different than TESP? You may have noticed in the previous explanation that the units are different. TESP is inches of water column (iwc) and FR is inches of water column per 100 feet (iwc/100’). TESP is a static pressure and FR is pressure lost as you move down the ducts. If you start with 0.25 iwc and have a friction rate of 0.1 iwc/100’, that means you can go 250 feet before you run out of pressure to push the air. Keep in mind that the static pressure at the end of the ducts, once the air leaves the register, is ZERO, by definition. TESP is how much pressure you have to burn. FR is how fast you can burn it and have nothing left at the end. TESP is like your monthly expense allowance and FR is how much you want to spend per day so that you spend it all.

FR only applies to the pressure that pushes the air through the ducts. TESP is the pressure that pushes the air through everything, ducts, fittings, filters, etc. This means you have to remove from the TESP things other than the ducts that eat up static pressure. That includes things like the evaporator coil, filters, air cleaners, dehumidifiers, humidifiers, grilles, registers, dampers, etc. These are called component pressure loses (CPL). What you are left is something called “available static pressure” (ASP), which is essentially the static pressure available to just push the air through the ducts. If you know that number and how long your ducts are, you can figure out what your “pressure budget” is. In other words, how much pressure can the air use up as I go down the ducts from the fan to the register. Sound familiar? The units of this pressure budget is iwc per foot. The problem is that when looking at just one foot it is a very small number. Going back to the monthly expense budget analogy, it would be like how much you can spend per minute. This is too small and too precise to make sense. To make it more manageable (less decimal points) they multiply it by 100 and the units are iwc per 100 feet. More like dollars per month. As long as you keep track of those 100 feet by keeping them in the units (iwc/100’), it all works out.

So, maybe a better analogy (less stupid) for TESP and FR would be a road trip. I love road trips. Let’s say have to rent a car for a business business trip and your boss gives you a total budget. TESP is this budget. ASP is how much money you have left after you plan for meals, hotel, incidentals, etc. FR is like how much you can spend, per mile, on gas.

Let’s say you start with $200 dollars total and what you have left for gas is $100. And you have to go 500 miles. This means you can spend $0.20 per mile ($100/500 miles). If gas costs $3 per gallon, you better have a car that gets at least 15 miles per gallon ($3 per gal / $0.20 per mile). No problem. If you have to go 800 miles, you can only spend $0.125 per mile ($100/800 miles), so you better have a car that gets at least 24 mpg ($3 per gal / $0.125 per mile). If you spend more on meals and you only have $80 left for gas and you have to go 800 miles, you can only spend $0.10 per mile ($80/800 miles), so your car better get 30 mpg ($3 per gal / $0.10 per mile). And so on.

So, in this road trip analogy the $200 you start with is your TESP. The $100 or $80 you have left for gas is your ASP. The distance you can travel is the length of the ducts. The amount you can spend per mile is your FR. So what does the fuel efficiency of the car represent? Well, that would be how big your ducts are. Bigger ducts are more efficient. They burn less pressure for each foot the air travels (a more efficinent car burns less dollars for each mile it travels) Note: in the analogy dollars can be converted directly to fuel ($3 per gallon), so they are basically the same thing.

Let’s see how well this analogy works.

All else being equal, if you start with a higher expense budget (higher TESP), after usual expenses you will have more gas money (higher ASP) and you can afford more dollars per mile (higher FR) so you vehicle doesn’t have to be as efficient (smaller ducts).

Another way to look at this is if you don’t want to have to drive a Prius (huge ducts), you have the following options:

  1. Start with more money (higher TESP)
  2. Not have as many expenses other than gas (less static pressure losses, resulting in higher ASP)
  3. Not drive as far (shorter ducts)

If you think about a real duct system and how far the air has to travel, the distance varies from register to register. Some registers are very close to the supply plenum and some can be very far away. Taking the road trip analogy to the next level, a duct system is like a series of roads to and from a town. The furnace is downtown. They always design roads so you have to pass through downtown. The roads traveling business people typically come in on are the return ducts. Roads that they leave town on are supply ducts. Some routes in and out of town to their final destination are shorter and some routes are longer. If you look at option 3, above, this implies that for shorter runs, you don’t have to have as big of a duct. This makes perfect sense. If you have a fixed expense budget and don’t have to drive as far, you can drive a less efficient vehicle (small ducts). If you have to drive farther, you have to have a more efficient vehicle (bigger ducts). It varies for different routes through town.   Some routes require a Prius and some can be Ferrari. (Interestingly, the analogy holds up well here because the less efficient car goes faster which is analogous to smaller ducts having a higher velocity, which is true! hmmm)

What this is really saying is that you can have a different friction rate for different paths that the air can take through a duct system. Some HVAC duct design software programs have the option to toggle between using the worst-case FR or using a variable (custom) friction rates for each run. With computers doing all the work, I don’t see any good reason to base your entire duct system on the longest run. Back in the day, when we had to do all the calculations by hand with a calculator and a pencil, it was a pain to calculate and keep track of so many friction rates. We just found the worst case and based everything on that, knowing that it would oversize the ducts on the shorter runs. But this can actually cause some serious balancing problems if there was a big difference between the longest run and the shortest run. I’ve seen it happen. To this day, I still prefer a duct layout where all the runs have about the same length because it took away, or at least lessened this difference between the worst case and best case runs. The ability to make all of you duct runs the same length of course depends on the location of the air handler relative to all the supply registers and return grilles.

By the way, using variable friction rates to size ducts will result in what is sometimes referred to as better “self balancing”. If longer ducts are relatively bigger and shorter ducts are relatively smaller, when you turn the system on the airflow delivered to each register will be closer to what you were shooting for. If however, you use the worst case FR for all of the ducts, the shorter ducts will get much more air than they need. I remember one time we did this and there was a laundry room very close to the furnace. We sized the duct using a friction rate based on much longer run and the duct was oversized. Oversized, plus being super close to the furnace meant that the laundry room got WAY more air than it needed. Unfortunately, guess what was just outside of the laundry room . . . the thermostat. This one oversized duct caused the thermostat to shut off the system way too early. The entire 2200 square foot first floor of a very expensive 4000 square foot tract home was not comfortable because of this one duct. Fortunately, this was discovered in the sales model and the fix was to just damper down the airflow in the laundry room. We adjusted the design after that and they all worked wonderfully.

Another thing to think about is that even though two lengths of ducts could be the same in terms of feet, one could have a lot more resistance than the other if one is straight and the other has a bunch of bends and turns. The road trip analogy actually explains this pretty well. Driving one mile down a perfectly straight road will result in better gas mileage than driving one mile where you have to make a bunch of 90 degree turns every block. So, the route with turns will require a more efficient vehicle (bigger ducts). But the distance traveled is the same, so how to we account for that? Manual D assigns something called equivalent lengths to bends and turns and other fittings. An equivalent length of 20 feet is like saying this bend has the same resistance as 20 feet of straight duct. Very interesting.

So, instead of just using actual duct lengths we use actual lengths plus equivalent lengths, we can account for the resistance (loss of static pressure) for turns and bends and fittings. Nice! This is called Total Equivalent Lengths (TEL)

The equation for determining gas budget per mile, let’s call that the money burn rate, on a road trip is:

                                         MBR = (TEB – UE) / MTG

Where:

                                        MBR = Money Burn Rate ($ / mile)

                                        TEB = Total Expense Budget ($)

                                        UE = Usual expenses, other than gas ($)

                                        MTG = Miles To Go (miles)


The equation for FR is:

                                        fr = (TESP – CPL) / TEL

Where:

                                        TESP = Total External Static Pressure

                                        CPL = Component Pressure Losses

                                        TEL = Total Equivalent Lengths

Notice the small ”fr”? That’s because we haven’t multiplied it by 100 feet to make it a more easy to use number. So, the actual equation is:

                                        FR = [(TESP – CPL) x 100] / TEL

Remember that (TESP – CPL) is sometimes referred to as ASP, available static pressure.

I highly suggest you memorize this equation, because it is very useful. You can shorten it to:

                                        FR = ASP x 100 / TEL

Here is the BOTTOM LINE:

Higher friction rate = smaller ducts. I have the hardest time remembering this. It comes out backwards in my brain for some reason. Just 
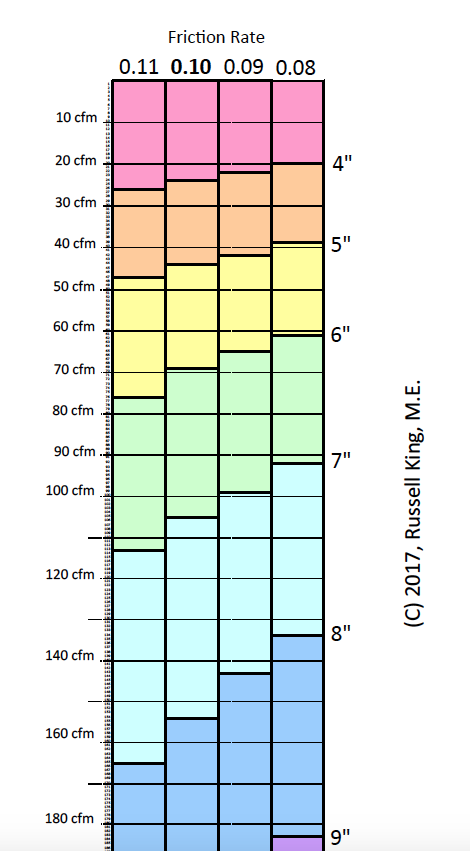
think of it like this. Smaller ducts eat up more pressure, which means more friction, which means a higher friction rate.  Here’s where it is really confusing: A system with higher friction rate will deliver more air for a given duct size.  Wait, higher friction rate is better? That’s totally counter-intuitive.  Maybe the way to think of friction rate is not as a description of the ducts but as a description of what the system can handle.  If there is plenty of ASP and not a lot of TEL then the system can handle a higher burn rate.  It’s able to tolerate smaller ducts.  It can overcome more resistance to airflow.  I hope I unconfused you.  If not, just be like me: Go back and look at something, like this blog post, and get it straight before saying something dumb.

In the diagram above or to the right, depending on your screen size, notice that at a friction rate of 0.11, a 6″ duct (yellow) will deliver up to 77 cfm.  At a friction rate of 0.08 it will only deliver 61 cfm.  In other words, if you needed to deliver 70 cfm to a room, you could use a 6″ duct if the run was shorter and the friction rate was less than 0.10, but if the friction rate was 0.09 or lower, you would need a 7″ duct (green).  Also notice that at 80-90 cfm the friction rate can be anywhere between 0.11 and 0.08 and a 7″ duct would work.  It’s only in those border regions where it matters, but it REALLY matters.  The difference between a 7″ duct and a 6″ duct at a FR of 0.1 is 105 cfm vs 70 cfm.  That’s a decrease in airflow of 1/3 by going down just one duct size!

Looking at the equation.  Things that make the friction rate smaller (ducts bigger) are

  1. Less ASP
  2. Less TESP (results in less ASP)
  3. More CPS (results in less ASP)
  4. More TEL

Putting this in plain words, bigger ducts are needed if you:

  1. Have less pressure available to push the air through the ducts
  2. Have less total pressure from the fan
  3. Have more components eating up static pressure
  4. Have longer ducts and/or more bends or fittings that the air has to travel through

Whew. Well, there you go. Friction rate can be explained as a road trip, after all. Maybe. I hope that helps explain friction rate. If not, let me know and I will try again. Maybe more graphs would help. I like graphs.

Russ


© 2020 Coded Energy, Inc. – Developers of Kwik Model 3D HVAC Design Software

New 3D HVAC Design Software – Finally!!

2 Comments

I’m going to keep this short and sweet.  I’ve been working on a side project with my son, a software wiz, for over a year.  I decided a long time ago that it was time for a major improvement in residential HVAC design and energy modeling software, or at least in how information is taken from the plans and put into that software.  We finally have something that we are ready to show off and I couldn’t be more excited.

When I set out to design it I had a few simple goals:

  1. It has to be easy and fast – Too many smaller projects, especially existing homes, don’t have the time budget to do a full blown ACCA Manual J/S/D layout using currently available software.  We need something fast enough that it can even be used as part of the bidding process.
  2. It has to be graphical and look like a house and not just be a bunch of numbers in a table. – Humans are visual creatures. It is too easy to make mistakes when looking at a bunch of numbers.  We need to be able to see that something looks right.
  3. It has to be three dimensional (3D) and draw ducts realistically and to scale. – The hardest part of designing a residential HVAC system is figuring out how to make the ducts fit.  Looking down on a 2D plan set just isn’t good enough.  This has always been mutually exclusive with goal #1, above, because 3D always meant some kind of CAD.  But, what if you could quickly build the house out of room size blocks rather than draw the house line by line?

I think we’ve done a very good job meeting these goals, if I may say so.  It is called Kwik Model.

We are not finished, but we are very close.  Check out this 6 minute and 33 second (sped up 4x) video that shows me creating a 3D model of a 1750 sf house and then laying out a full 3D duct system all in about 27 minutes.

I’ve created a YouTube Channel HERE and will try to regularly upload new videos that demonstrate Kwik Model’s features and capabilities.

Stay tuned!  We are close . . . so close.

How to Quickly Evaluate a Residential HVAC Duct Layout

33 Comments

Something I get asked to do on a regular basis is take a look at a duct layout for someone’s house and see if it “looks OK”.  Here is a good example.  Suppose someone showed you this sketch of a 3.5 ton system and said, “Does this look OK to you?”  You might look each trunk/branch combination and say, “a 10″ serving two 8″ ducts, that seem OK.  A 16” return duct on a 3.5 ton, that seems reasonable.  Each run might look reasonable and there are registers in all of the rooms, but the main question should be, “Will ALL of the ducts handle ALL of the air?”

In about 10 minutes I can tell you if there are any serious problems related to duct sizing. Here is how I do it.

Table 1 – Duct Size vs. Airflow at a Friction Rate of 0.1

1. Figure out how much air is the system is supposed to handle. I usually use 400 cfm per ton (condenser tonnage) as a minimum.  If the designer tells you a higher number, use that.
2. Are there enough supply trunks to handle this much air? List the diameters of all the start collars coming off of the supply plenum. Use the airflow table, right. This table represents how much air a certain size duct should handle in a “reasonably well-designed” system (friction rate = 0.10 iwc/100ft).  Add up all of the flows – they should be greater than the target flow (from #1).
3. Are there enough supply branch runouts to handle this much air? Repeat step 2 for the supply branches (ducts that serve a single supply register).
4. Are there enough return ducts to handle this much air? Repeat step 2 for the return ducts.

This test will not tell you if the equipment is over or undersized, nor will it tell you how well the system is balanced – whether the air is going to rooms in the right amounts, relative to other rooms, but it will quickly identify one of the most common problems: undersized ducts that impact overall airflow to the system.

Let’s do it for this sketch: The target airflow would be 3.5 x 400 =1400 cfm.  The four main trunks add up to 1200 cfm – NOT GOOD.  The supply branch runouts add up to 1270 cfm – NOT GOOD.  I frequently see 16″ returns on 3.5 and even 4 ton systems.  A 16″ duct should only handle about 1050 cfm – VERY BAD.  This system would run at a much higher static pressure and probably would not pass the minimum air flow and maximum fan watt draw test of CA’s Title 24 energy code (350 cfm/ton and 0.58 watts/cfm) and those are not meant to be hard numbers to beat, but far too few installers know how to properly size ducts.  Some even take the time to use Wrightsoft or Elite Manual J/S/D software but then have some hidden setting in them that messes everything up. (See my article about why we need a simpler Design Methodology).  Most installers just use old rules of thumb that result in these substandard systems.  Kudos to those who actually do a good job.  Their numbers are growing, but far too slowly.

If they had used a better design methodology they might have come up with this revised version of the same plan.  The revised layout passes this quick test.  The four main trunks add up to 1800 cfm, which is good. The supply branch runouts add up to 1480 cfm, which is close, but OK. The return is a 20″, which can handle 1875 cfm, which is very good. Note that an 18″ duct would barely work.  The intermediate “trunks” can be checked independently in a similar manner.  This layout will probably work just fine, at least in terms of delivering 1400 cfm.  Something that I have found to be true in many cases is that very good overall airflow will forgive a lot of sins, including minor balance issues and even minor over or under-sizing of equipment.  It’s not that hard to do, folks!

Sorry for lack of posts

2 Comments

Hi Everyone,

I started this blog when I was working for myself.  A couple years ago I got a “real job” working for someone else because I had a son in college and another one getting ready to go and I needed a more steady and reliable income stream.  I have not had the time to create new blog articles and I’ve barely had enough time to reply to the comments on the existing articles.  I was going to take the blog down, but people seem to still find some use in it and it still gets 10-20 hits per day.

If you leave a comment asking a question, please know that it may be a while before I get to it.  Also, please be aware that as a consultant, I sell my time.  A lot of comments I get are basically people asking me to design all or part of their system for them (for free).  I probably will not reply to those.  Sorry.

For more information on the topic, I encourage you to check out my book:  HVAC 1.0 – Introduction to Residential HVAC Systems.  In California, our utilities are excellent resources for training.  Check them out.  If your specific utility doesn’t offer it, try one of the others.  You may have to travel a little bit, but they are usually free or very cheap and open to anyone.

Thanks for all you support and positive feedback.

Russ

How a House is Like a Tank of Water

5 Comments

Happy 2014, everyone. 2013 was a good year for me. It certainly did not go the direction I would have expected with the California Energy Commission work lasting all year, but it was a blessing and I’m very grateful. I realized that I only posted two blogs last year. Even though those two blogs generated a ton of feedback and even a little controversy, I resolve to do much better this year.

Great news! SMUD has generously offered to sponsor my “HVAC 1.0 – Introduction to Residential HVAC Systems” for FREE! Obviously, it is based on my book of the same name. You even get a free copy of the book (a $29.99 value). Here is a link to sign up: https://usage.smud.org/etcstudent/ClassDescription.aspx?Id=895 Right now it is to be offered on March 6 at their headquarters. If the demand is high and the response good, they could very well offer it again. If you can’t make it on March 6, be sure to tell them that you’d love to see it offered on a different date.

I’ve been experimenting with making this class an on-line class. I’ve taken some of the power point slides and some audio files of me speaking and created a short movie. We all hate the way our recorded voices sound and I’m no exception. I speak much more slowly and sound a lot more like Mr. Rogers than I do when I teach live.

As an experiment, I started with Appendix A. This is the “Tank of Water Analogy” that I’ve been using for years and getting excellent feed back. It’s amazing how a simple analogy can really help explain something that’s much less intuitive. It’s definitely the most basic part of the book. Other sections are far more technical. This was a good section to experiment with.

There are a lot of different ways to do on line training. For me, the most effective is the one that you can easily pause, rewind, replay. My plan is to take a class that can easily go 8 hours live and condense it down into about 5-6 hours worth of videos, none of which are more than 20 minutes long (hopefully).

Please take a look at this sample. It is about seven minutes and let me know what you think. I suggest that you frequently hit the pause button and let what was just said in the video sink in for a few seconds. Otherwise, I have found that minds tend to wander . . . Squirrel! (I watched “Up” over Christmas break. Great family movie.)

Russ

What’s a Few Degrees Amongst Friends? – Picking A Summer Outside Design Temperature

9 Comments

Merry Christmas . . . uh . . . Happy New Year! . . . ahem . . . Ok, so it’s been a while since my last blog . . . Sorry for the hiatus.  I was put on a support contract to help California Energy Commission staff write the updated (2013 code) version of the Residential Compliance Manual and that took me off line for a few months.  I have a newfound respect for the hard working folks at the Energy Commission.  They truly want the code to be fair, practical and enforceable.  That’s a much harder task than any of us on the outside realize.  All in all, there are many improvements to the code this time around.  The compliance software is still a big mystery.  The new dynamic forms will be very cool once the bugs get worked out.

The topic of today’s blog post is summer outside design temperatures and why you shouldn’t stress over them.  More precisely, there are other things far more important to stress over.

ImageA few years back, I literally had a contractor refuse to install my HVAC design solely because I chose a summer outdoor design temperature that was two degrees lower than what he thought it should be.  I was using the temperature required by the energy codes and recommended by ACCA and ASHRAE.  Granted, the project was a few miles away from the city that the temperature was measured for, and granted, it was on the other side of a small ridge.  Even if the “true” summer outside design dry bulb for the precise location of the project was 2 degrees higher than what I used, how big of a difference does that really make?  According to him, all the difference in the world.

His argument was that it would cause the A/C to be undersized and result in homeowner complaints that HE would have to deal with, not me.  First of all, as a licensed mechanical engineer, I am totally responsible for the performance of any mechanical plan that I stamp and sign.  Yes, he would be the first one they called, but if it turns out that my design was the cause of the problems, I would be responsible for fixing it and for paying for his time to respond to it.

The first thing to realize is that typical residential A/C systems only come in a few sizes.  1.5, 2, 2.5, 3, 3.5, 4 and 5 ton sizes.  Roughly speaking these represent sensible cooling capacities of numbers something like 12,000, 16,000, 20,000, 24,000, 28,000, 32,000, and 40,000 btuh.  Basically, what happens is that you do your load calcs and then you pick the next size up.  So, if your sensible load is 13,000 Btuh, you would have to pick a two-ton because a 1.5 ton system would not be enough.  (Note: these sensible capacity values are very crude.  They are probably a little low.  I’m making them up because it’s easier to work with round numbers and I am too lazy to get some real numbers; however, real numbers would illustrate the exact same point.  Actual sensible capacities come from detailed performance tables published by the manufacturer and depend on indoor temperature and humidity, outdoor temperature, airflow across the coil and, of course, make and model.  Please don’t use these as rules of thumb.  I disavow any responsibility for them.  If you want to learn how to determine these for real equipment, read ACCA Manual S.)Image

For a typical 3 to 4 ton load in a fairly new home, changing the summer outside design temperature from 98 to 100 adds about 1,000 to 2,000 btu to the sensible cooling load.  The reason that it is a fairly small number is because the indoor and outdoor temperatures establish the temperature difference (delta-T) between the inside and outside of the house.  This delta-T only affects loads caused by conduction through the building shell (heat transfer through solid walls, ceiling, etc.) and convection into the conditioned space (outside air leaking into the house).  This delta-T has no impact on the largest single source of heat entering the house in the summer – solar gains.  Solar gains can be 30-40 percent of the sensible load and do not change due to outside temperature.  Neither do internal loads.

Did you know that a house with an indoor summer design temp of 75 and an outdoor summer design temp of 100 will have about the same cooling load as a house with an indoor summer design temp of 65 and an outdoor summer design temp of 90.  (65 is not a reasonable indoor summer design temp.  Don’t use that.  Use 75.  This was just another dumb example to make a point.)

So, let’s say your sensible cooling load calc at 98 deg is 29,000.  That would suggest a 4 ton system.  If you re-ran it at 100 deg and it went up to 31,000, a four-ton system would still work.  Your load calc at 98 deg would have to be over 30,000 before changing the temperature to 100 deg would even hint that you needed to go up to the next size equipment.  In this case, that would be a five-ton system.  So, lets just say for laughs that my load calc at 98 deg came out at 31,000.  If I caved to the contractor and reran the calcs at 100 deg, they would come out at around 33,000.  Too big for a 4 ton, so we would have to go to a 5-ton that delivers 40,000 btuh, sensible.

But, are we really doing the homeowner a service by putting in a system that is oversized by 7,000 btuh (21% excess capacity).  Wouldn’t it make more sense to really look at what this means and maybe try to find a way to make the 4-ton system work by dropping the load of the house back to 32,000?  (The answer is YES.  It would make tons more sense to do that.  Pun intended.)

Also, what exactly does the summer outdoor design temperature number represent?  Currently, we use a value called the “1% Summer Design Dry Bulb”.  It can be found for pretty much any city in California (there are about 750 listed) in the 2008 Joint Appendices, Appendix JA2.2.  What does the 1% mean?  Well, you can scan through Reference Appendix JA2 and by looking at cities you are familiar with, you will notice right away that it certainly doesn’t represent the hottest day of the year.  It’s usually well below that.  What it means is that the outdoor temperature is higher than that number only 1% of the time over however many years the data was collected for.  (Also notice that they list a value for 0.1%, 0.5% and 2%.  The code requires that you use the 1.0% value.)ImageAnother way of looking at this number is that 99% of the time, the actual cooling load is less than the load calculated using that temperature.  The system is perfectly sized for the few hours where the temperature is exactly the design temperature.  Let’s be generous and say that’s about 1% of the time.  This means that 98% of the time the system is oversized and will cycle on and off (or not run at all).

So, if our cooling load and cooling capacity were exactly the same, let’s say 32,000, then 1% of the time the load is greater than the capacity of the equipment and it cannot remove Btus as quickly as they are coming in.  When this happens, the temperature in the house will creep up.

If you didn’t know this already, a perfectly sized air conditioner will run continuously when the outdoor temperature is at or above the design temperature.  This is a good thing and the reason why is a discussion for a later blog, perhaps.  Just suffice it to say that cycling on and off is about as good for an air conditioner’s efficiency as stopping and starting is for your car’s MPG.

Let me also say this:  There is no such thing as a perfect load calculation.  They are a SWAG, which is only little better than at WAG (A WAG is a wild-ass guess.  A SWAG is a scientific wild-ass guess.)  Trying to calculate an exact sensible cooling load is like trying to measure the average diameter of a cotton ball with a micrometer.  Where do you draw the line?  The best you can do is document your assumptions and hope that you are right most of the time (99% is pretty good, by the way).

So, what ultimately happens during that 1% of the time when the A/C cannot keep up?  The indoor temperature shoots up like your car parked in the sun, your favorite leather chair burns skin off of your back, all the plants wilt, the goldfish are parboiled, and the kid’s crayons melt into pretty little puddles of color.  No.  None of these things happen.  What actually happens is the indoor temperature will creep up a few degrees.  If the set point is 75 degrees, it will rise up to 76, 77, maybe 78 degrees. (Seventy-eight degrees was the indoor design condition for many years by the way). How fast it takes to do that depends on the house.  One of the biggest factors is how much insulation and thermal mass the house has.  Thermal mass stores Btu’s in the winter and Bcu’s in the summer.  A “Bcu” is a Bubba’s Cooling Unit and it is equal to -1 Btu, see an earlier blog on that topic.

A fairly new, reasonably well-built house will rise about 1 degree per hour.  Whether or not that becomes a big problem depends on how hot it gets outside and how long it stays above the design temperature.

ImageThe above graph shows a hypothetical house that has the equipment sized exactly to the load.  Remember that this usually doesn’t happen when you pick the “next larger piece of equipment”.  Normally, there is some excess capacity in a properly sized system.

The red line is a typical pattern for outside temperature in the summer for a fairly hot city like Fresno or Sacramento.  This graph shows two consecutive “hot” days where the outdoor temperature exceeds the design temperature by several degrees for a few hours.  Remember, this only happens 1% of the time.

When it does happen, what happens to the indoor temperature?

The indoor temperature is represented by the blue/green/pink line.  When the line is blue, the indoor temperature is below the thermostat set point, of 75 degrees, for example.  This happens when it is cooler outside than inside.  When the line is green, the indoor temperature is right at 75 degrees.  This happens when the outdoor temperature is above 75 degrees but below the outdoor design temperature.  When the line is pink, the indoor temperature is above 75 degrees.  This happens when the outdoor temperature is above the outdoor design temperature.  Notice that if these were weekdays, the pink bump is happening mostly when no one is home.

Something else to realize is that when the line is blue, the A/C is not running at all.  When the line is green, the A/C is cycling on and off.  When the line is pink, the A/C is running continuously.  Interesting?  I think so.

So, does that graph represent something that the typical homeowner would complain about?  Possibly.  Homeowners have a right to be picky.  They are spending a lot of money on their home.  Are there things a homeowner can do to make sure this doesn’t happen (without changing the size of the A/C)?  Absolutely.  Remember, this only happens on the few hottest days of the summer and in a system with no excess capacity.  Most homeowners know when hot days are going to happen and can take reasonable precautions.

Most cooling loads are calculated with the assumption that some or all of the interior shades (drapes, etc.) open.  Keeping all of the drapes closed during hot weather makes a huge difference.  Planting shade trees around a house makes a big difference.  Even neighboring buildings provide shade not accounted for in the load calcs.  Pre-cooling or overcooling the house can help too.  This is when you set the A/C down a couple extra degrees, cooling the house down a little extra at night, and letting the thermal mass of the home help keep it cool during the hottest time of the day.

Did you know that a house with less thermal mass will have a taller hump in the pink part of the line.  A house with more thermal mass will have a flatter hump.

The vast majority of homeowner complaints about cooling that I have dealt with did not stem from undersized equipment and certainly would not have been solved by using a higher outside design temperature.  They stemmed from poorly built homes (leakier than expected, poorly installed insulation, etc.), underperforming cooling systems (poor refrigerant charge, low airflow due to undersized ducts, leaky ducts, etc.) and poor thermostat operation (turning system on and off and not letting it reach equilibrium).

ImageThis graph represents a more normal hot summer day.  Where it does not quite reach the design temperature outside.  These are far more common than the previous example.  Notice that there is no pink bump where the indoor temperature drifts up.  Realize though, that the lower the outdoor temperature is, the more often the system will cycle on and off.  This reduces efficiency.  The ultimate question then becomes, is it worth having a less efficient system the vast majority of the time just to prevent the indoor temperature from creeping up a few degrees on very hot days (which can be prevented with simple precautions).  I vote no, but that’s just me.

By the way, the same contractor that I mentioned at the beginning of this blog also told me that a 16” return duct is fine for a 4-ton system (hint: that’s not even close).  So, the moral of that story is: stop quibbling over things that we cannot control, like the weather, and start quibbling over things we can control, like quality construction, quality system design, good air flow, and proper thermostat operation.

Duct Size vs. Airflow – Part 1

65 Comments

If you are enjoying these posts and  learning something, you may enjoy my class, “HVAC 1.0 – Introduction to Residential HVAC“.  I will be adding more classes and dates regularly, please subscribe to my newsletter, The Sierra B.S. Newsletter.  (B.S. stands for building science, of course) by sending an e-mail to info@sierrabuildingscience.com.  If you know anyone who may benefit from this kind of information, please pass it along.

Today’s topic is Duct Siz vs. Airflow.  This is Part 1 of a two or three part series on this topic.

One of the big misconceptions about airflow is how to determine how much air will flow through a certain size duct, or conversely, determining what size duct you need to deliver a certain airflow.  You would not believe the range of flows I have heard as “rules of thumb”.  This assumes that you have done the calculations necessary to determine how much air is needed in a room.  That will be a different series of blog posts, to be sure.

Duct sizing is covered very well in ACCA Manual D and is fairly straightforward.  For now just suffice it to say that there is a very important number called “Friction Rate” that determines the relationship between duct size and airflow.  Friction rate describes the average pressure drop per 100 feet of duct in a system.  Notice that this number is unique to a system, not just an individual duct run.  For example, all things being equal, an 8” duct at the end of a long convoluted duct system will not deliver as much air as an 8” duct on a very short straight system.  This is because everything that the air passes through has an impact on how much air comes out of the very end.  Friction rate is a wonderful number because it takes into account how much static pressure you fan is providing, how much of that is left after you subtract out the big-ticket items like the coil, filter, supply registers and return grilles.

A common system configuration.

But, you say, most systems do not have runs that are 100 feet long!  What use is that number that is “per 100 feet”?  Actually, if you look at something called “equivalent lengths” a duct run can be well over 100 feet “long”.  Equivalent lengths are numbers that can be looked up in an appendix of ACCA Manual D.   This is where a fitting such as a t-wye or elbow is assigned a number that represents a length of straight duct that that has an equal pressure drop.  For example a t-wye might have an equivalent length of 10 feet.  A ninety degree elbow might have an equivalent length of 15 feet.  A round start collar coming off of a sheet metal supply plenum can have equivalent lengths approaching 30 feet or more.  When you add up the actual lengths and the equivalent lengths, it adds up quickly.

Even if the length of the run is very short, you can still use friction rate because the 100 feet is just a number they decided to use.  They could have used pressure drop per 10 feet or even 1 foot.  It just adds more decimal places.  Don’t dwell on it.  Move on.  Get over it.  Just don’t forget about it.  One of the biggest mistakes I’ve seen contractors make is to confuse total operating static pressure (inches of water column) with friction rate (inches of water column lost per 100 feet).

The details of how to calculate friction rates are covered later, but a very common friction rate for a reasonably well-designed designed system is 0.1 iwc/100’.  You can take that number and using a duct slide rule, duct calculator, or friction rate chart and determine duct size for a given airflow or determine how much air will come out of a given size duct.

Table 1 – Duct Size vs. Airflow at a Friction Rate of 0.1

Table 1 is an example of the airflow that you would get from various size vinyl flex ducts in a system with a friction rate of 0.1 iwc/100’.

Now, I’m taking a huge risk by putting this table out there and I will probably get a lot of grief for it, but here it is.  The danger is using it on systems where the friction rate is something other than 0.1.  (I use this table all of the time as a first guess, ball park number and it works fine.  Of course, I fine-tune the calculations later, but it’s always pretty close.  It’s a hundred times better than some of the numbers I’ve heard contractors rattling off.)

One of the first comments I used to get on my designs was that odd size ducts are not used.   Did I mention that I have done about 2000 residential HVAC designs?  Ninety-nine percent of them were for medium to large production home builders.  What they meant to say was that odd size ducts are not normally stocked by their local wholesaler.  That’s because none of the contractors used them.  Supply, demand, etc., etc.

What if you did a detailed load calculation (ACCA Manual J), carefully selected equipment (Manual S), and knew exactly how much air each room needed.  Now you are in the process of sizing ducts (Manual D).  Let’s say that you had a room that needed 95 cfm.  If you were a contractor who did not use odd size ducts, your choice would be between a 6″ duct, which does not give you enough air, or an 8″ duct with gives you almost twice what you need.  Which would it be?  Six inch, of course.

NO!

Suck it up and use 7″ duct, cheap skate!

Here’s some other interesting ways to use this table.  If you have a room that needs 197 cfm and another right next to it that needs 72 cfm what kind of t-wye will you need to serve these two rooms?  To deliver at least 72 cfm, you will need a 6″ duct.  To deliver at least 197 cfm you will need at least a 9″ duct.  The trunk that serves these two ducts needs to be able to deliver 72 + 197 = 269 cfm.  Using Table 1, that means a 10″ trunk.  By the way, a duct that is split into more than one duct is called a “trunk”, just like a tree.  Ducts that are on the end of a trunk and terminate in a register are called . . . branches!  How about that?  And that’s why we call registers “leaves”.  Just kidding.  Nobody does that.

So, the t-wye will need to be a what is commonly referred to as a 10-9-6 sheet metal t-wye.  Any contractor who complains about this not being and “off-the-shelf” fitting probably has not done many installs from a carefully designed plan.  If they really complain, just tell them to round the odd sizes UP, Making this a 10-10-6 t-wye.

Next:  Part 2 – Why two 6″ ducts will not deliver the same air as one 12″ duct.  Seems obvious, doesn’t it.  Stay tuned.

Again, all of these blog posts are based on the training materials and topics covered  in my HVAC 1.0 Class.  If you know anyone who might benefit from this kind of information, please refer them to my website.  www.sierrabuildingscience.com.

Thanks!

Russ

Older Entries